Chemical Kinetics
Chemical kinetics is all about how quickly chemical reactions happen. One way to speed up a reaction is to add more reactants. This was discovered by chemists Peter Waage and Cato Guldberg in 1864, and it's called the law of mass action. But there are other factors that can also affect reaction speed. For example, if you put magnesium in water, it will fizz a little. But if you add steam, the reaction will be much faster. In this article, we'll explore all aspects of chemical kinetics, including laws like collision theory and factors that influence reaction speed. We'll also explain kinetic graphs, teach you how to calculate reaction rates, and introduce you to the Arrhenius equation. Finally, we'll show you some real-world applications of chemical kinetics.
Rate of reaction in chemical kinetics
Chemical kinetics is all about how fast chemical reactions occur. Rate of reaction is a way to measure this speed. It tells us how quickly reactants are used up, or how quickly products are formed, during a chemical reaction. Some reactions happen super fast, while others are really slow. For example, rusting of an iron nail can take years. The change in concentrations of reactants and products is gradual, so the rate of reaction is slow. Essentially, rate of reaction is just a way to measure how quickly one substance turns into another.
Measuring rate of reaction
There are various ways to measure rate of reaction. The key is to measure the change in amounts of reactants or products. For example, you could measure the change in mass of a reaction with gaseous products, or measure the volume of gas given off for a reaction with gaseous products. If the reaction produces a cloudy suspension, you could measure the light passing through the solution. Alternatively, you could measure the change in pH of a solution. To measure rate of reaction, start your reaction and take measurements at regular time intervals. Record both the time and measurement value in a table. Once the reaction is complete, plot a graph with time on the x-axis and your measurement on the y-axis. Join the points up with a smooth curve. To calculate rate of reaction, find the gradient of this curve. Don't worry, we'll explain how to do this later on.
Units of rate of reaction
The units of rate of reaction vary, depending on what you are measuring. Examples include g s-1, cm3 s-1 or mol dm3 s-1.
Laws of chemical kinetics
Chemical kinetics, and the rate of all reactions, is based on one underlying law: the principle of collision theory. It’s a simple concept, but from it we can derive many of the factors affecting rate of reaction. First, let’s define collision theory.
Collision theory
Collision theory is an explanation for the rates of many reactions. It proposes two key ideas: particles must collide with the correct orientation, and have sufficient energy for a reaction to occur. Simply put, reactions can only happen if particles collide. But, for a reaction to occur, the particles must collide in the correct orientation and have enough energy. For instance, in a reaction between chloroethane and a hydroxide ion to form an alcohol, the lone pair of electrons on the oxygen atom must collide with the carbon atom in the C-Cl bond. If the hydrogen atom in the hydroxide ion collides with the other end of the ethane chain, nothing will happen. The molecules must be orientated correctly for a reaction to occur.

Correct orientation is not the only requirement for a successful reaction. Even if the hydroxide ion and chloroethane molecule collide in the correct orientation, they still need to have enough energy. This energy is known as activation energy (Ea), which is the minimum amount of energy needed to start a chemical reaction. Reactions need some initial energy to break the bonds in the reactants. Breaking bonds is an endothermic process, meaning it requires energy. Energy is then released when bonds form to make the products. In summary, for a reaction to occur, two particles must first collide, have the correct orientation, and have enough energy. Only when all these criteria are met will a successful collision occur, resulting in a reaction.
Factors affecting rate of reaction
Collision theory explains that particles require the correct orientation and sufficient energy for a reaction to occur. To increase the rate of reaction, we can change the orientation, energy, or frequency of collisions of particles. Increasing surface area, concentration, or pressure increases the frequency of collisions. Increasing temperature supplies more energy to the particles, increasing both the frequency and proportion of successful collisions. Catalysts provide an alternate reaction pathway with lower activation energy, increasing the proportion of successful collisions. Some catalysts also position particles in the correct orientation for successful collisions. Kinetic graphs are useful tools for understanding the relationships between different factors and the rate of reaction. There are three types of kinetic graphs: enthalpy diagrams, Maxwell-Boltzmann distributions, and rate of reaction graphs.
Enthalpy diagrams
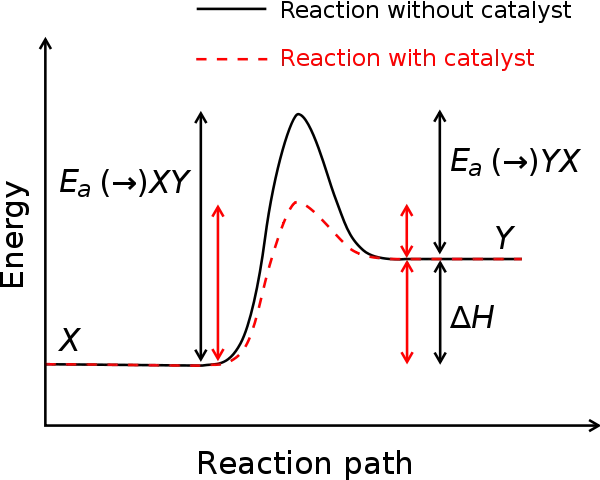
An enthalpy diagram is a graph that shows certain characteristics of a reaction, such as the reactants’ starting energy, the products’ final energy, and the activation energy. Enthalpy diagrams are also known as energy profiles. Look at the graph below. It is a great example of an enthalpy diagram for the formation of sodium chloride. In this reaction, sodium reacts with chlorine gas to produce the salt sodium chloride.
The graph tells us a few things.
The products have less energy than the reactants. This makes the reaction an exothermic reaction - overall, energy is released. There is a peak in the curve between the reactants and the products. This is the activation energy we talked about earlier. To start a reaction, particles must collide with enough energy to get over this energy barrier. Let’s now look at an enthalpy diagram for an endothermic reaction. One such example is the reaction between sodium carbonate and ethanoic acid.
In the presence of a catalyst, the enthalpy diagram for a reaction will have a lower peak. This is because catalysts lower the activation energy requirements of a reaction. As the peak on the enthalpy diagram represents the activation energy, a lower activation energy means a lower peak. This can be observed in the graph, where the peak is lower in the presence of a catalyst than without one.
The highest point of the graph at the top of the peak is known as the transition phase. At this point, all the bonds within the reactants have broken but new bonds haven't quite formed, and the molecules and atoms exist as unstable intermediates. Breaking bonds is an endothermic process, meaning that it requires energy, and this is what the activation energy is used for. Head over to Enthalpy Changes to explore enthalpy diagrams in more detail.
Maxwell-Boltzmann distributions
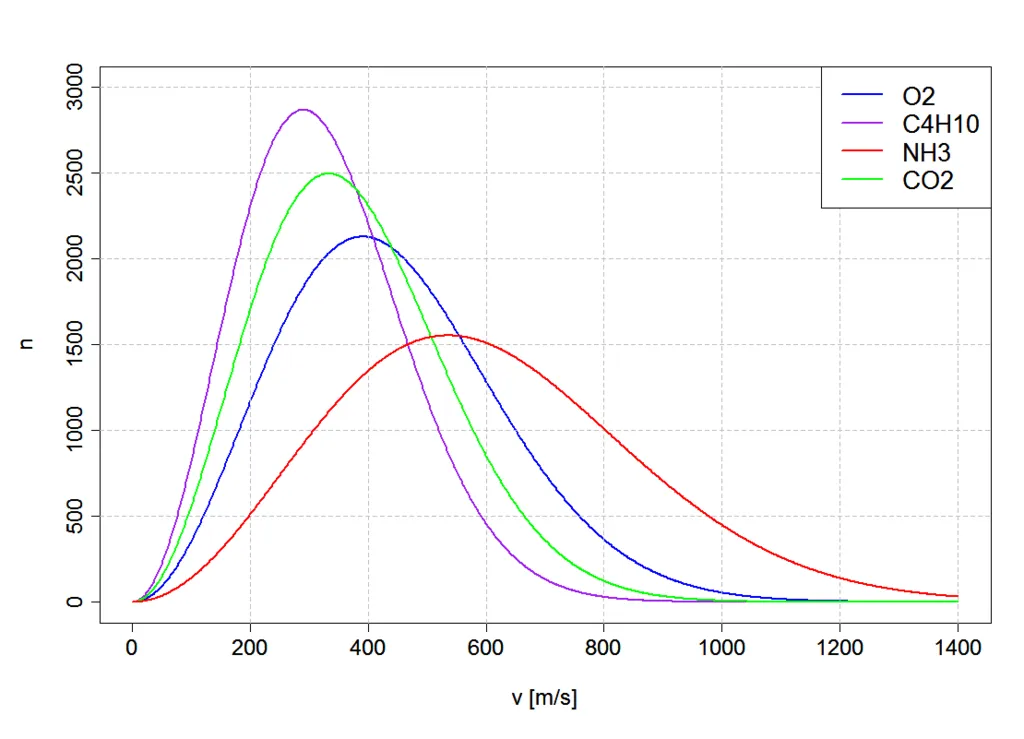
The Maxwell-Boltzmann distribution is a probability function that displays the distribution of energy amongst the particles of an ideal gas. The distribution shows that different particles within a gas have different energy levels, with some having a lot of energy and others having only a little. The graph plots the number of particles on the y-axis and energy on the x-axis. The graph typically shows three key points: the most probable energy, the average energy, and the activation energy.
What does this tell us?
The most probable energy on a Maxwell-Boltzmann distribution is the mode energy value, representing the energy level that the greatest number of particles possess. The average energy is the median energy value, with exactly half of the particles having more energy and half having less energy. The area to the right of the activation energy on the graph represents the number of particles that meet or exceed the activation energy, which correlates to the proportion of successful collisions in the reaction. The area under the graph represents the total number of particles in the system. By exploring the Maxwell-Boltzmann distribution, we can observe how factors such as temperature and the presence of a catalyst can influence the energy distribution of the particles.
Rate of reaction graphs
To graph the rate of reaction, we measure the change in the amount of reactants or products over time. For example, in the reaction between sodium carbonate and ethanoic acid, the rate of reaction can be measured by recording the volume of carbon dioxide gas given off. This is done using a gas syringe and taking readings at regular intervals, which are then recorded in a table. The data points can be plotted on a graph with time on the x-axis and volume on the y-axis, ideally showing a smooth curve. This graph provides a visual representation of the rate of reaction over time.
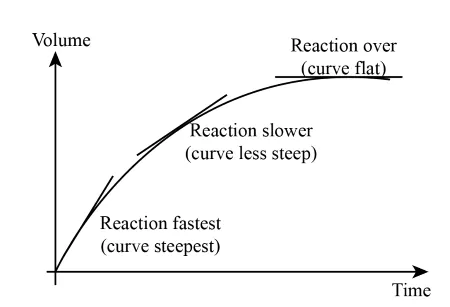
Note the following:
The slope of the initial steep part of the graph indicates a high rate of reaction, with a large amount of product being produced quickly. As the curve levels out, the rate of reaction slows down, indicating that the product is being produced at a slower rate. The graph eventually levels out completely, indicating that the reaction has stopped and no more product is being produced. In this case, the reaction ends at 80 seconds.
To calculate the overall rate of reaction, we divide the change in the volume of the product produced by the time taken for the reaction to finish. In this example, the reaction stops at 80 seconds, so we would use the change in volume of over 80 seconds to calculate the rate of reaction.
.webp)
The overall rate of reaction is therefore
To find the units of rate of reaction, look at the units of the two variables you are measuring. Here, we are measuring volume in cm3 and time in seconds, s. The equation for rate of reaction is volume ÷ time. If we substitute the units into this equation, we get cm3 ÷ s = cm3 s-1.
Sometimes you might not want to find the overall rate of reaction, but instead calculate the rate at a particular point in time. To do this, you draw a tangent to the curve at the required time and calculate its gradient. Let’s say you want to find the rate of reaction at 10 seconds. First, draw a tangent to the curve at 10 seconds. This is a straight line that just touches the curve at the 10 second mark. Next, mark any two points on the tangent. Here we’ve chosen the points where t (time) = 0 and t = 30.Calculate the change in height of the tangent between these two points. In our case, height represents volume. You do this by subtracting the volume at t = 0 from the volume at t = 30, using values taken from the tangent, not the curve itself. Here, .Calculate the change in width of the graph between these two points. Here, .Find the gradient of the tangent by dividing the change in height by the change in width. Here,
Here’s a diagram of the calculation to help you understand the process.
Chemical kinetics equations
We’ll now turn our attention to equations in chemical kinetics. These include: Differential equations Rate equations The Arrhenius equation
Differential equations and rate equations
Differential equations are equations containing a variable and one or more of their derivatives.
Take the reactant A. We can represent its concentration using [A]. In mathematical terms, its change in concentration is the derivative of [A]: . But you’ll remember that rate of reaction is just the change in amount of reactants or products. Therefore, is simply a way of representing rate of reaction.
In chemical kinetics, we use differential equations to show how the rate of reaction, , depends on the concentration of A, [A], at a particular instant. One example of a differential equation that you do have to know is the rate equation. The rate equation of a chemical reaction is an equation that links the rate of reaction to the concentrations of species involved in the reaction. We explored earlier how concentration affects the rate of a reaction. However, this effect isn’t always linear. Sometimes changing the concentration of a particular product has a small effect on the rate of a reaction. Sometimes it has a large effect, and sometimes it has no effect whatsoever. The rate equation links the concentrations of reactants with the rate of reaction using powers, called orders, and a rate constant, k. It typically takes the following form: Note the following: k is the rate constant, a value that varies for each reaction.[A] represents the concentration of A.x represents the order of the reaction in respect to A.x + y equals the total order of the reaction. Rate equations is a weighty topic. You’ll learn more about it in Rate Equations.
The Arrhenius equation
- An equation that links the rate constant to temperature, activation energy, and the pre-exponential factor
- Helps to predict how changes in temperature affect the rate of reaction
- Takes the form:
- k is the rate constant
- A is the pre-exponential factor
- e is Euler's number
- Ea is the activation energy of the reaction
- R is the gas constant
- T is the absolute temperature
Applications of chemical kinetics
You can imagine that controlling the rate of a reaction has many different uses. For example, you might want to slow down the decay of a product or increase the rate of an industrial reaction. Chemical kinetics therefore has lots of applications. These include:
Storage of drugs and pharmaceuticals to increase their shelf life. Adding preservatives to food to prevent it from going bad. Choosing the best catalyst for industrial processes. Deciding on the optimal temperature for baking biscuits and cakes. Radiocarbon dating.
Chemical Kinetics - Key takeaways Chemical kinetics is a branch of physical chemistry that is all about the rate of chemical reactions. Rate of reaction is a measure of either how quickly reactants are used up, or products are formed, in a chemical reaction. In other words, it is the change in concentration of reactants or products over time. Chemical kinetics is based on collision theory. Collision theory states that particles need to collide with the correct orientation and sufficient energy in order to react. Factors affecting rate of reaction include temperature, pressure, concentration, surface area, and the presence of a catalyst. An enthalpy diagram is a graph that shows certain characteristics of a reaction, such as the reactants’ starting energy, the products’ final energy, and the activation energy. The Maxwell-Boltzmann distribution is a probability function that shows the distribution of energy amongst the particles of an ideal gas. To calculate rate of reaction, you plot a graph of change in amount of either product or reactant against time, and calculate the gradient of the curve. The rate equation of a chemical reaction is an equation that links the rate of reaction to the concentrations of species involved in the reaction. The Arrhenius equation is an equation that provides a relationship between the rate constant, the absolute temperature, activation energy, and the pre-exponential factor. Applications of chemical kinetics include preservatives for food and medicine and using catalysts to speed up industrial reactions.
Chemical Kinetics
What are the applications of chemical kinetics?
Applications of chemical kinetics include storing pharmaceuticals to increase their shelf life, adding preservatives to food to prevent it going bad, using catalysts to speed up chemical reactions, and radiocarbon dating.
What is collision theory in chemical kinetics?
Collision theory is an explanation for the rates of many reactions. It proposes two key ideas: particles must collide with the correct orientation and sufficient energy in order for a reaction to occur.
How do you find the order of reaction in chemical kinetics?
To find the order of reaction in chemical kinetics, you need to find the order of all the different species present in the rate equation. You can do this by looking at data showing the rate of reaction for different concentrations of the various species. For example, if you double the concentration of A whilst keeping all other variables the same, and the rate of reaction doubles as a result, you know that the reaction rate is first order with respect to A. If you double the concentration of A and the rate of reaction increases fourfold, you know the reaction rate is second order with respect to A. Check out the article “Determining Rate Equation” for more.
What is rate of reaction in chemical kinetics?
Rate of reaction is the change in concentration of reactants or products over time.
How do you calculate chemical kinetics?
This depends on what you want to calculate. For example, you could use the Arrhenius equation to see how the rate constant k depends on the temperature of a reaction. You could also use the rate equation to see how the rate of reaction varies according to the concentrations of different species. More simply, you could calculate rate of reaction by measuring the change in concentration of a product or reactant and dividing it by the time taken.


