Chi-Square Test
The Chi-Square Test: What it is and How it Works for Science Experiments
If you're doing an experiment and want to compare what you've measured against what you expected, you can use the Chi-Square test. First, you create a hypothesis and then convert it to a null hypothesis, which says there is no relationship between two parameters. We use it to check if our hypothesis is valid. It's impossible to prove something with certainty, but we can disprove a null hypothesis to accept that our hypothesis is correct. We use "confidence levels" and "critical values" to do this.
For example, let's say you're studying trees in a forest and want to know if there's a difference in the number of trees per 5m^2 from the forest's outside to the center. You'd create a hypothesis that tree density increases as you move toward the center and a null hypothesis that there's no significant variation in tree density.
When you conduct your experiment, you'll end up with two types of results: statistically significant and statistically insignificant. If the results are significant, it means something is happening that wasn't accounted for. Scientists commonly use the Chi-Square test to determine if biological hypotheses have significant results.
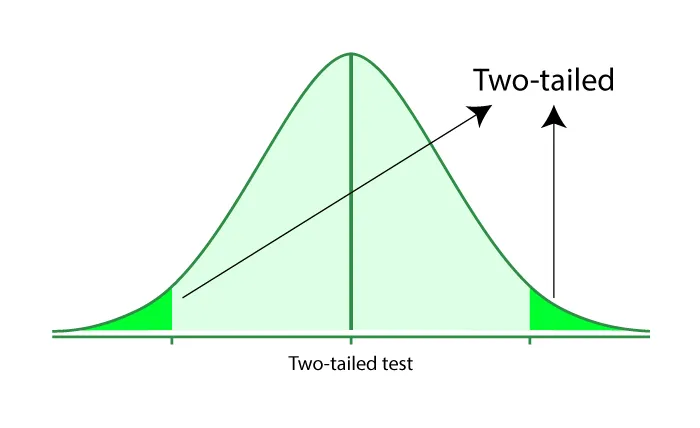
Finally, you can define your hypothesis as one-tailed or two-tailed. One-tailed hypotheses predict a uni-directional result, while two-tailed hypotheses predict a bi-directional result. For our tree-density example, a one-tailed hypothesis would be that tree density increases toward the forest's center, while a two-tailed hypothesis would be that tree density changes toward the center.
Things to Know About Chi-Squared Tests
Chi-squared tests should only be done using categorical data that can be sorted into groups or categories. Categorical data can be further divided into nominal (values you can count but not order, e.g., eye color) and ordinal (values you can count and order, e.g., house numbers).
It's also important to note that chi-squared contingency tests are used to test whether there is an association between two categorical variables. This is different from the regular chi-squared test, which is used to compare observed and expected values.
Before conducting a chi-squared test, specific criteria must be met. This includes having a large enough sample size, having independent observations, and having expected values that are greater than or equal to 5.
Overall, chi-squared tests are a powerful tool in statistical analysis but should only be used with categorical and after ensuring that all criteria are met.
What are the criteria for performing a chi-squared test?
Only raw counts can be used – not ratios, rates, fractions or percentages. The comparison between theoretical (expected) and experimental (observed) results is being made.
What are the assumptions of the chi-squared test?
Additionally, the chi-squared test makes several assumptions:
The comparisons are made on random samples. The expected count of each cell is greater than one (>1).No more than 20% of the cells have expected counts less than 5 (<5).
How do you calculate chi-squared?
The formula looks very scary - but don’t panic! We can break it down into steps.
What is the formula for chi-squared?
In other words, chi-squared is the sum of the square of the difference between the observed values and expected values , divided by the expected values (E).
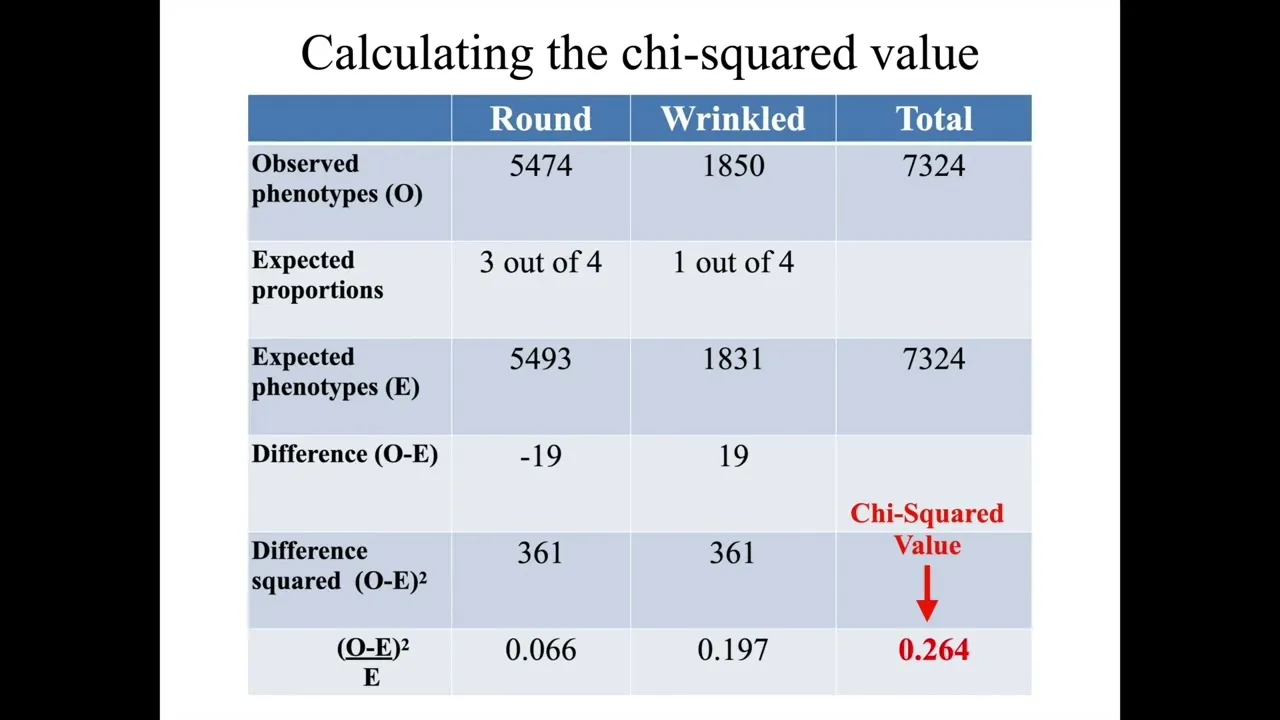
To help you understand how we would calculate the chi-squared, we will use flower phenotype as an example.
To calculate:
Obtain the expected and observed results for the experiment (as shown in the table below)Calculate the difference between each set of results Square each difference Divide each squared difference by the expected value Use the sum of these answers to obtain the chi-squared value
How do you calculate degrees of freedom and use a chi-squared distribution table?
The Chi-Squared test has little meaning on its own – it needs to be compared to ‘critical values’, which are found in tables or on graphs as calculated by statistical experts. First, you must decide the confidence level you want to use. The most common is generally 95% and/or 99%, meaning for every 100 times you carried out the test, you would get chance results on five occasions or one occasion.
Correct, after obtaining the chi-squared value, we use a distribution table to determine the probability of obtaining such a result due to chance. The table shows the critical values for different degrees of freedom and p-values. The degrees of freedom for a chi-squared test is always the number of categories minus one (n-1).
In genetics, chi-squared tests are commonly used to determine if the observed results of a genetic cross are significantly different from the expected results based on theoretical predictions. For example, Mendel's experiments on pea plants demonstrated patterns of inheritance for observable traits like seed type. If the observed results deviate significantly from the expected results, it suggests that the genetic cross did not go as predicted.
To perform a chi-squared test in genetics, we first calculate the expected values based on theoretical predictions and then compare them to the observed values. We then use the formula to calculate the chi-squared value. If the chi-squared value is greater than the critical value obtained from the distribution table, it indicates that the observed and expected values are significantly different from each other, and the deviation is not due to chance. Otherwise, the difference between the observed and expected values is not significant.
The chi-squared test can be summarized in a table to help with calculations. The table includes the observed and expected values, the difference between them, the squared differences, and the final value obtained by dividing the squared differences by the expected value. We then use the chi-squared distribution table to determine the critical value and compare it to the obtained chi-squared value to determine if the difference between the observed and expected values is significant or not.
What if the observed values are significantly different from the expected values?
If the observed values are significantly different from the expected values, we need to consider other factors such as sex linkage, autosomal linkage, and epistasis. These factors can affect the inheritance patterns and cause deviations from the expected Mendelian ratios.
The chi-squared test is a statistical test used to determine if the observed and expected results of an experiment are significantly different. It can be performed on large sample sizes and categorical data. The test involves calculating the chi-squared value, which is the sum of the squared differences between the observed and expected values divided by the expected values.
To determine if the difference between the observed and expected values is significant, we use a chi-squared distribution table to find the critical value for a given degree of freedom and p-value. If the obtained chi-squared value is greater than the critical value, then the difference is significant, and we reject the null hypothesis.
Degrees of freedom in a chi-squared test are calculated by subtracting one from the number of categories. It is important to consider other factors that may affect inheritance patterns when analyzing the results of a chi-squared
Chi-Square Test
What is chi-square in genetics?
A chi-squared test is used to see if the difference between the observed and expected results of an experiment is statistically significant. Chi-squared tests are often used on biological data.
How do you determine the degrees of freedom?
The degrees of freedom are equivalent to the number of categories (n) minus one. df = n-1
How do you calculate the chi square test?
The chi-squared test is calculated with the equation
What is a chi-square test used for in biology?
To identify if results are statistically significant when comparing observed and expected results.
When would you do a chi-square test?
When we are comparing observed and expected results.
How do you interpret a chi-square test?
We use the value we have obtained in the Chi-Squared test to see if the data is statistically significant. A distribution table is used for this. The distribution table relates the chi-squared value with probabilities. We also use degrees of freedom to determine the number of comparisons made.


